Using R to detect growth in perfmon resource metrics

I have started using the statistical package R to detect any trends in performance test data. In this example I am looking to detect windows perfmon metrics that increase over the duration of a performance test.

You can install R an open source statistical analysis package from here http://www.r-project.org/

The code below can be cut and pasted into the R gui command line but you will have to change the first line of the script to use the directory holding the data file (procs.csv).

The comments should give you an idea what it is doing..

setwd("C:\\Documents and Settings\\alee\\My Documents\\Projects\\youProject\\")

# Load the Data isetednto a Data Frame

pData <- read.csv("procs.csv",sep=",",header=TRUE)

NumOfCols <- length(names(pData))

# Create a metrix to hold the gradients

slope <- 1:NumOfCols

# Loop through the metrics and calculate the slope

for(i in 2:NumOfCols ) {
     x <- 1:length(pData[[i]])
     y <- pData[[i]]
     # Ignore any blank columns
     if ( is.na(y[[1]]) )
          {slope[[i]] <- NA }
     else
     {
          fit <- lm( y ~ x)
          slope[[i]] <- fit[[1]][[2]]
     }
}

results=data.frame(metric=names(pData),Co=slope,OrgOrder=1:NumOfCols)

OrderResults <- results[order(-results$Co),]

#plot top 5 growing metrics

for(i in 1:5)
{
     OrderResults[i,3]
     plot(pData[[OrderResults[i,3]]],type="o",col="blue")
     title(main=names(pData[OrderResults[i,3]]), col.main="black", font.main=4)
     # Prompt for Enter so plot stays on screen long enough to be read
     readline(prompt = "Pause. Press to continue...")
}

Data points needed for Universal Scalability Curves

I did some testing for a single transaction type in to a SOA environment. For different numbers of threads (workload) in Jmeter I measured the throughput (transaction per second) for a 10 minute period. The results are from the graph below:

From looking at the results I wondered how well I could apply Neil Gunther’s
(Universal Scalability Law). The USL is an equation that allows you to take a sparse set of load measurements and from those determine how your application will scale under larger user loads than you may be able to generate in your test lab. This can all be done in a spreadsheet tool like Excel.

I was interested to see just how many data points I would need. So, I plugged my data into Excel. I did three predictions. The first was using all the 8 data points collected during the test. Next I used the first 4 collected during the test and finally I used 4 data points spread throughout the test. The graph below shows the predicted scalability curves.

Using the first 4 data points (which looked linear’ish) then it predicted the maximum throughput would be around 75 tps and the graph didn’t show the degradation at higher thread values. What was interesting was that the spreadout results are close to the predicted curve using all the measurements.

This was my first attempt to use the scalability curve. The spreadsheet from Neil website was easy to use and I am impressed in this example that with only a few datapoints the results were close to the prediction curve using all the data points. I think I will need to do more similar experiments before I am a convert! But it looks promising.

Performance Engineering and Toilets

I was reading the paper on Saturday and noticed this snippet about student Li Tingting occupying a men’s public toilet to protest about unequal waiting times. Local Officials have promised to increase the number of Ladies toilets by 50% to decrease waiting times. Strange to some but some of the calculations we use in performance engineering can help calculate if 50% is enough to reduce waiting times.

20120225-210830.jpg

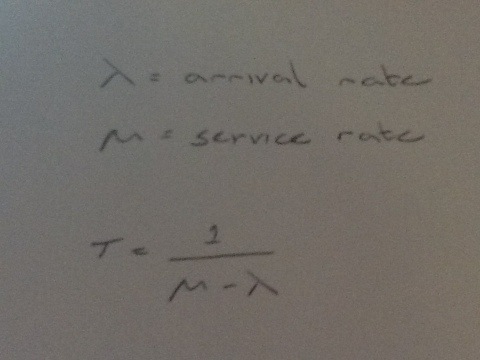
Using queuing theory a branch of mathematics, that allows us to calculate the waiting times if we know the arrival rate and the time customers spend being “serviced.” There are other consideration when using these calcuations so google “queueing theory”.

We know the “service time” for ladies and gentlemen using toilets thanks to studies done in New Zealand where it is a legal requirement that there should be a sufficient number of public toilet that the average time taken by a man is 40 seconds while it takes 90 seconds by a woman. The calculation below can be used for a single toilet and gives the time in the system for a know arrival rate and service rate.

20120226-130207.jpg

For a male toilet we can service 90 men per hour (3600 seconds in an hour divided by 40 seconds per visit) and for a female toilet we can service 40 women per hour (3600 seconds divided by 90). For a range of arrival rates using the calculation above we can calculate the average time in the system (waiting plus doing business) and plot this on the graph below:

As you can see as arrival rate increases the time women spend increases more quickly. Also note how it gets worse as the arrival rate approaches the service rate.

The example above is just for a single toilet example, but there are equations that can calculate the time for multiple service centers (in this case toilets) and therefore can be used to calculate if a 50% increase in women’s toilets would reduce waiting times. Well the devil is in the details as to whether 50% is sufficient based on current arrival rates, current number of male/female toilets but I thought let’s try a few numbers. Let’s assume there is currently 10 toilets per sex and therefore we need to look at the time spent for a range of arrival rates for 10 male toilets and 15 female toilets. The graph below shows the times for different arrival rates.

As you can see the time significantly increase for ladies well before that of the men! 50% May NOT be enough.

OK, so why is an IT performance engineering blog talking about Chinese toilets. Well it is just an example of how some equations can be used to calculate things like response times where there are limited resources. Just like when considering “how many CPUs” you need for applications the same math can used.

Why do performance tests fail?

I have just been thinking recently about some of the reasons performance testing fails to stop performance problems occuring in the production environment. Below is a list of some of the reasons why performance testing can fail to spot these problems. Hopefully, the list below will provide, as a reminder of things to check next time you have to write a performance test plan. However, we must remember that like all testing, performance testing is about reducing the risk of failure and can never prove 100% that there will be no production performance problems. Indeed it may be more cost effective for some problems to occur in production than during test! Though your customer may not fully appreciate this approach.

So here is my list:

1) Ignoring the client processing time, performance test tools a designed to test the performance of the backend servers by emultating the network traffic coming from clients. They do not consider the delay induced by the client such as rendering and script execution.

2) Ignoring the WAN, again test labs often inject the load across a LAN ignoring any outside the data center network delays. This is a particular problem for chatty application when it comes to network traffic.

3) Load test scripts that do not check for valid responses, performance testing is not functional testing but it is important that for the test script you write they check they are receiving correct responses back. The classic problem has been tools that just check that a valid HTML code is returned. The problem with this is that the “We are busy” page has the same valid code as the normal page.

4) Poor workload modeling. If we can not estimate the user workload correctly the load test will never be right. You might do a great test testing for 10,000 users but that is no real help if 20,000 user arrive on day one. Don’t under estimate the need to get a good workload model.

5) Assuming perfect users, alas users are not perfect and they make mistakes, cancel order before committing and forget to log off. This leads to a very different workload than if all the users where perfect, putting a different load on the environment.

6) Bad Test Environments, a test environment should be as representative as the production environment as possible. I have seen failures particularly when the test environment has been undersized but also where is has not been configured in a similar fashion to production.

7) Neglecting Go-live+10 days performance issues, Performance testing typically focuses on testing the peak hour and a soak test. What is difficult to do in a performance test is to represent how the system will be after several days of operations. Systems can ground to a halt as logs build up and nobody has got round to running the clean up scripts or transactions slow as SQL cannot cope with the increased rows in tables.

8) Unexpected user behavior, Very difficult to mitigate this one as it unexpected! However, in many cases a lack of end user training has resulted in users doing the unexpected like the car part salesman that didn’t know how to use the system and did a wild card search to return the complete part catalogue and then scrolled through it to find the part manually each time! Caused a killer performance issue.

9) Lack of statistical rigor. You don’t need to statistical guru to run a performance test but you should at least run the test long enough and enough times to be confident that the results are repeatable.

10) Poor test data, like the test environment the test data should be as representative as possible. Logging in all the virtual users with the same user id may put a different load on the system then if each had their own user id.

How does Citrix Improve Response Times

I was asked the other day how does Citrix improve response times. The simple answer is that it cuts down on the number of times the user has to wait for information to be transfered across the network. For example the diagram below shows an application on a client PC communicating with the DB. In this case it is Oracle forms 6i and this can take between 20-60 network hops to get the data needed to display a screen.

chattynetworkapplication

If you are on the same LAN as the DB then you may not notice the delay but it you access across a WAN then the time to cross the WAN all adds up to a slow response time.

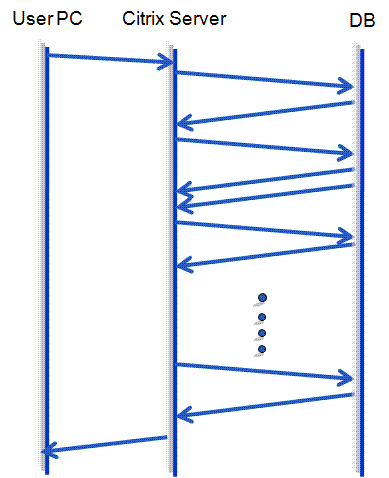
With Citrix the citrix server is placed in the datacentre close to the DB. The client then makes one request to the citrix server, the citrix server makes all the requests to the DB and then when the screen is complete send a picture of the screen back to the user. As can be seen in the diagram below.

chattynetworkapplicationcitrixperformance

As the citrix server and DB are closely located then the network hops needed to get the data to build the screen happen quickly and the user has to suffer the delay across the WAN only once. Where applications cross the WAN many times and the delay from the users to the server is high then Citrix is likely to help improve performance. However, you need to also consider the bandwidth of the pipe between the client and the server.

To do this you can create a performance model. The following presentation contain I performance model I built for determining when to deploy citrix to various locations as part of a large upgrade project. In that project the application made 7 trips across the network to generate the display for the user. Pages 12-21 provide the model and some results.

You can download the presentation here.